Todd Jones
Along with being the resident writer for MainWP and content hacker at Copyflight, I specialize in writing about startups, entrepreneurs, social media, WordPress and inbound marketing topics.

Data is all around us. Chances are you look at data every day. Maybe you have a spreadsheet loaded with Google Analytics information. Maybe you double check marketing statistics every day.
Making sense of data is a noble quest. In fact, finding the story in the data is more than a noble quest. It helps users see behind the numbers to find out what is happening.
Infographics are similar. It allows a pictorial representation of numbers and statistics. Often, infographics become something of a novelty which creates the kind of interest that gets content shared far and wide.
We’ve talked in the past about using infographics for more interactive content.
Earlier this month, I decided to do one for the MainWP blog. I thought it would be a good experience and give users something different to read.
This time of the year we are doing more planning, more looking at cat videos, more wearing ugly sweaters, and less digging into hardcore work. Therefore, I thought it might be a nice change of pace.
I thought about what I could display in an infographic. I also thought about social proof. Social proof is one of my favorite things to use. MainWP has its share of social proof from the user reviews on WordPress.org to the scores of people are happy with the product.
Other points of social proof include downloads and use for managing thousands of WordPress websites across the globe.
Therefore, I decided to use some numbers that MainWP has on its front page as data for my infographic. After all, people are regularly looking for a reason why to use a product. The infographic will instantly give them that reason.
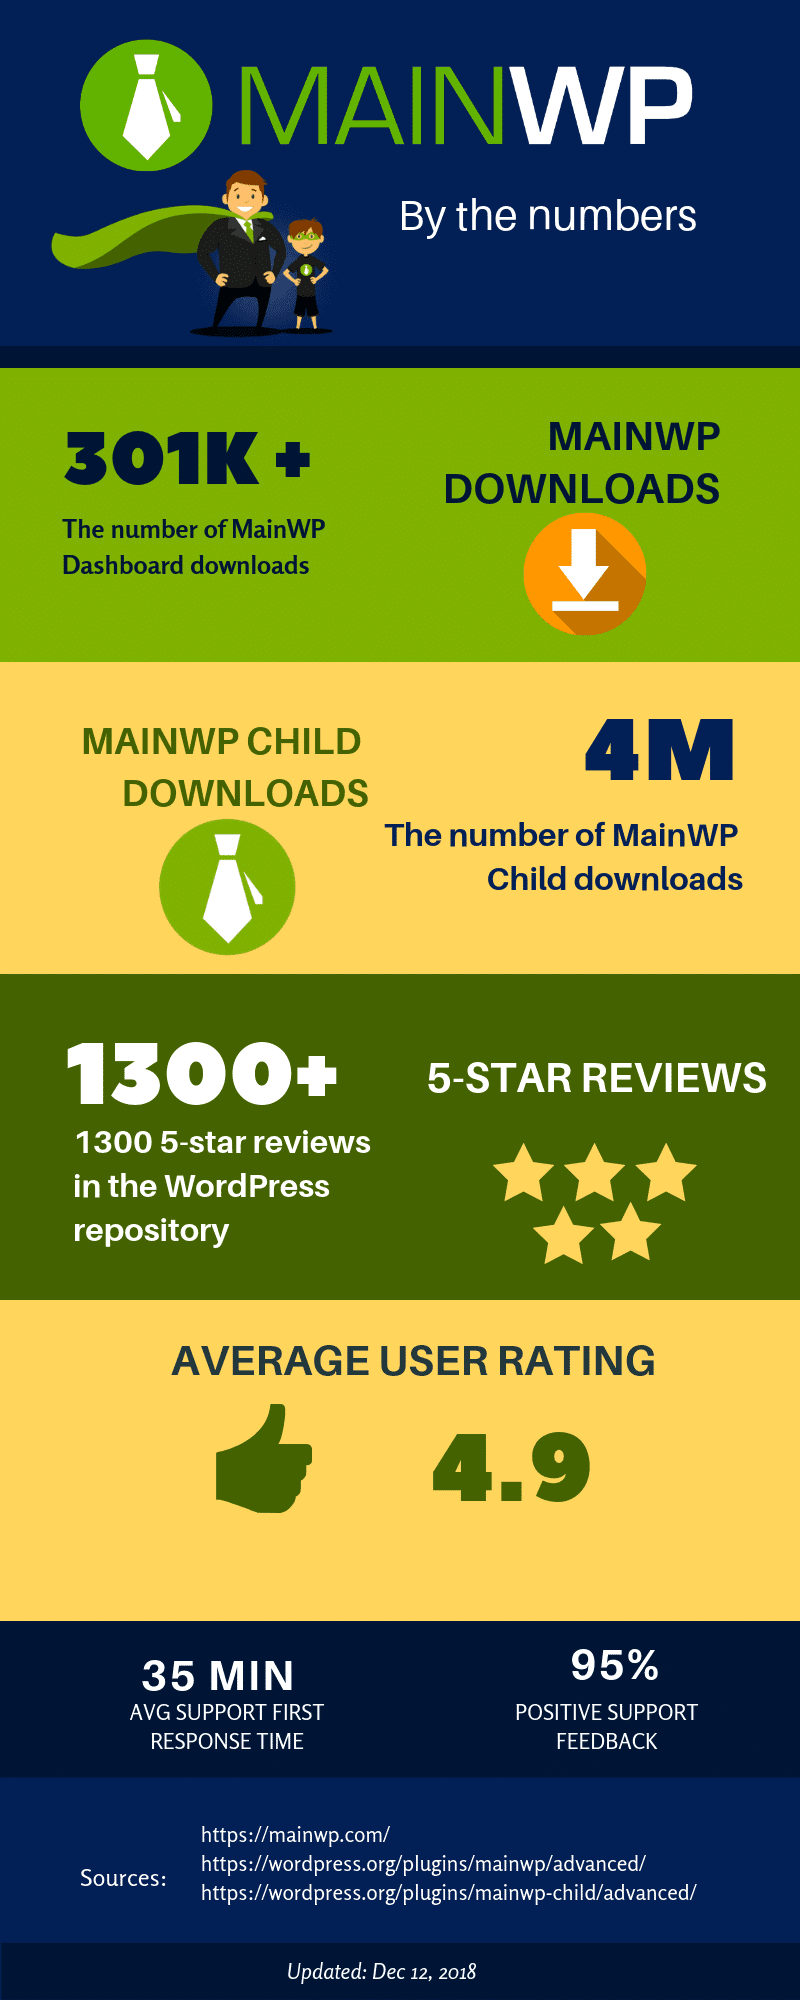
Here are the numbers I used for the infographic.
WP user rating 4.9 – This information comes straight from the MainWP plugin entry on WordPress.org.
5 Star reviews 1300+ – Also from WordPress.org
Sites managed w/ MainWP 300K+ – You can find this on the homepage of MainWP.com.
Positive Support Feedback 95% – Also on the MainWP.com homepage. Information courtesy of FreshDesk statistics.
Average Support First Response Time 35 minutes – Also on the MainWP.com homepage. The information is courtesy of FreshDesk statistics.
4M MainWP Child downloads – WordPress.org
301K MainWP Dashboard downloads – WordPress.org
Once I decided on the numbers to use, I decided on a software platform to create my infographic. I have a list of those on the article I wrote back in September. The list includes:
Canva
I chose Canva because I use it almost every day, but you can use whatever you want. Canva has a number of pre-created infographic templates you can use for your creation. I chose one that works for the numbers gathered.
Once I opened the template, I began changing the information to include the numbers I collected. I also added MainWP colors and changed some of the fonts. Further, I inserted graphics that better represented the information compiled.
I also let a couple of people look at the draft so that I didn’t miss anything. Towards the bottom, I used that section to add
Next, I used Octatools to generate the embed code needed for sharing
I uploaded the infographic to the MainWP media gallery. Then I input the correct information into the embed code generator fields. I copied the code that the generator created.
Next, I placed the code in the HTML tab of the editor in the MainWP post. Then, I added a full-sized version of the infographic above the embed code.
Note, if you are using Gutenberg, you will need to adjust the steps to include an HTML block for the embed code or used the text editor.
Hubspot has a very good article on how to execute this part of the process.
That’s all there is to do creating an infographic. It isn’t an easy thing, but it can be rewarding and give your content a big boost.
There are many reasons to use an infographic. In fact, Search Engine Journal author James Brockbank gives 8 such reasons some of which we have touched on in this article.
One of the things I think make infographics effective is that they are out of the normal routine of texted-based content. They also empower readers to share your content as well as your URL. Give it a try and let us know how it goes.
Manage Unlimited WordPress Sites from One Dashboard!