Todd Jones
Along with being the resident writer for MainWP and content hacker at Copyflight, I specialize in writing about startups, entrepreneurs, social media, WordPress and inbound marketing topics.

Last year, I got the idea of running a Web Care Survey.
Web Care Consultants are an invaluable part of the WordPress community. WordPress websites need someone to take care of them.
MainWP is one of the top providers of Web Care tools and we have a whole community of Web Care Consultants.
So I thought I would run a survey.
In 2021, we received 131 submissions. This year, I was really hoping to double that. If not double, I really hoped to have 200 responses.
See the results of the 2021 survey here.
Unfortunately, we did not get 200 responses, but we received 144 responses. We improved our submissions numbers, so I am happy with that.
Today, we look at the results of the 2022 Web Care Survey.
Open or Download Web Care Survey 2022 (PDF File).
2021 Results
2022 Chart
2022
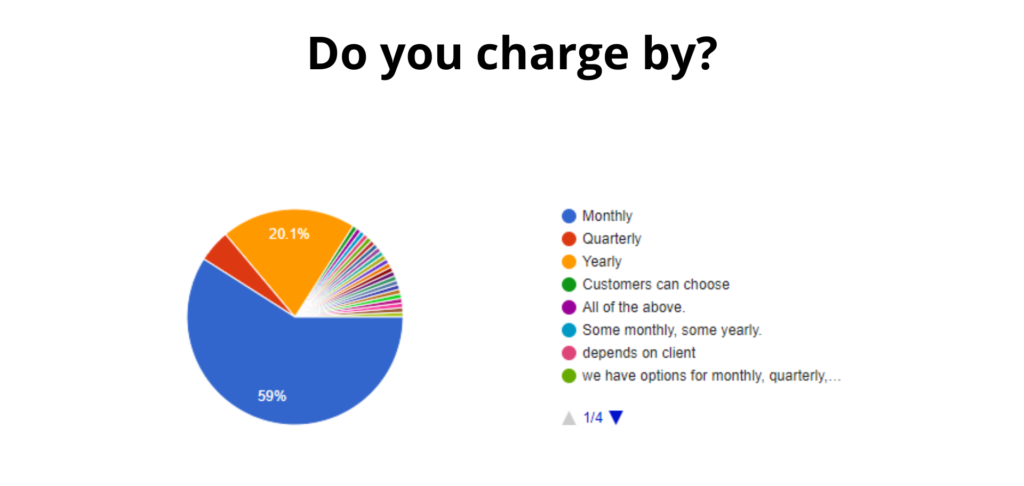
It was fascinating to find fewer people charging by the quarter. Charging monthly and yearly is still the top priority, but there is a significant number of people (16%) who do some combination or custom packages depending on the context of the website.
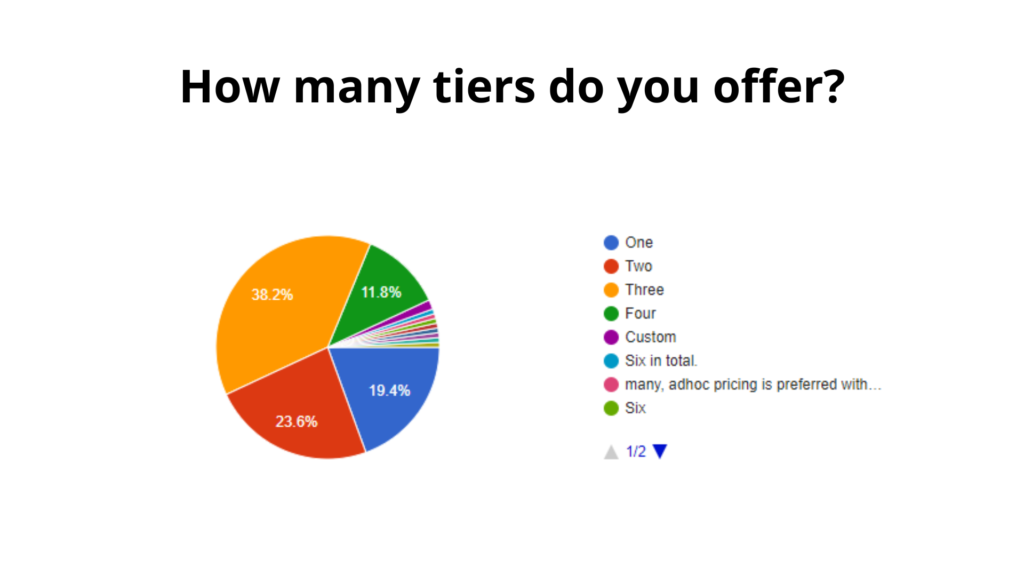
I did not ask this question last year. I felt from a pricing standpoint, there is a gap in the information because few people charge one rate, even if they do charge monthly or yearly. As you can see from the results, three tiers is the most common answer while a handful have four.
There are several people how various types of packages that not included in the main answers.
2022 Results
2022 Chart
2021 Results
2022 Chart
2022
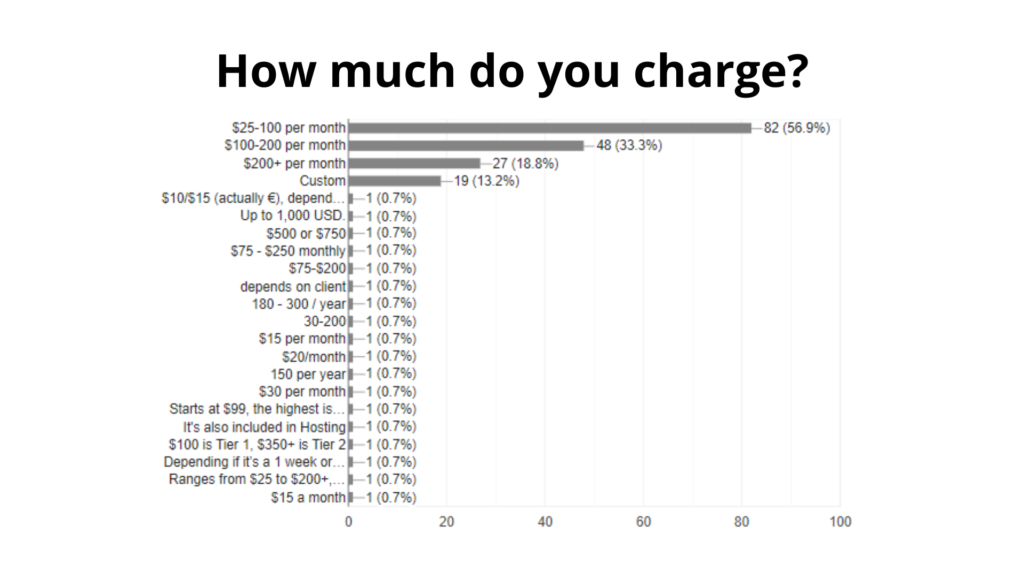
Prices are up across the board. This may be because we are experiencing global inflation and everyone has to go up. It may be a natural progression. It is good to see that Web Care Consultants can go up on their prices.
Consultants that do custom packages use a variety of things to determine those packages including support, addon products, upsells, level of interacting with clients, size of website or servers, scope of work, other services needed and the complexity of the tech stack.
2021 Results
2022 Chart
Results 2022
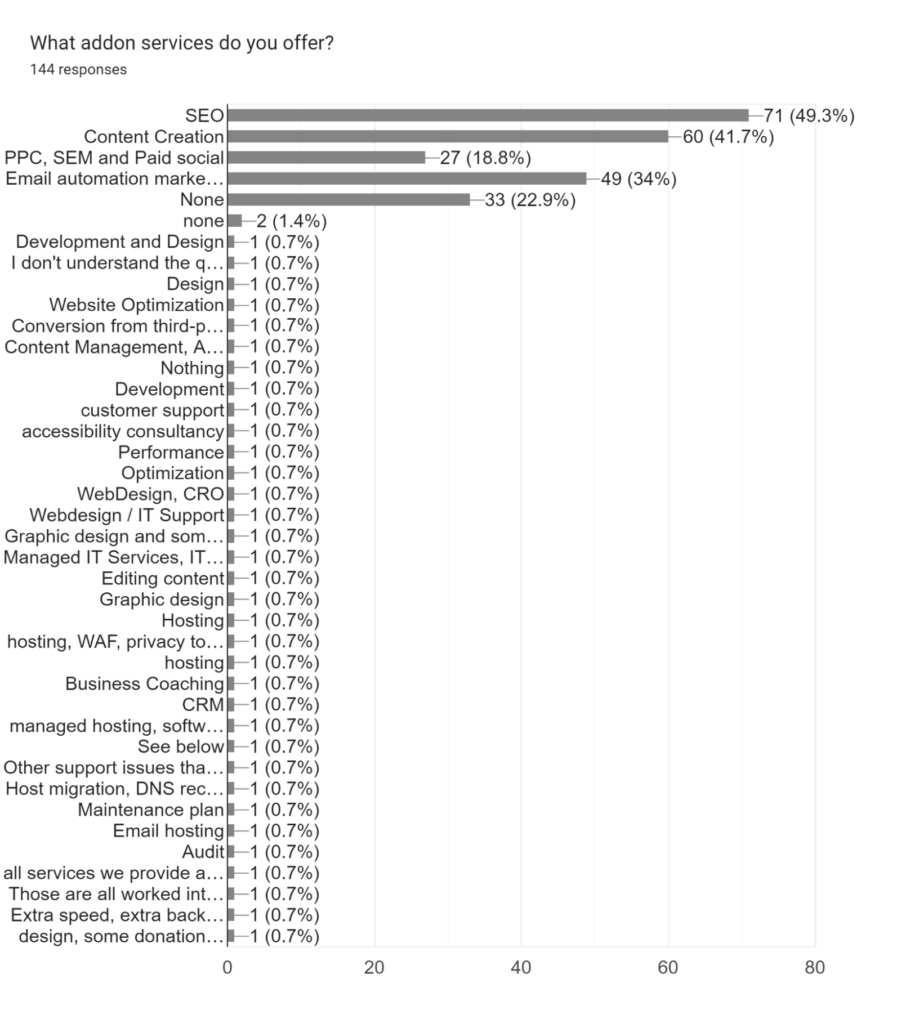
Add-on services are pretty similar to last year. SEO still leads the way, but it is down a bit.
In fact, everything is down a bit except for Email Marketing. The number who answered Email automation marketing is up from the Email Marketing in 2021.
I wonder if adding automation to the answer changed that or if more people are actually adding email marketing services.
The answer None is 22.9% this year. That is a surprising uptick from 8.4% last year. It makes me wonder if people are limiting their offers and becoming more of a web care specialist.
2021 Results
2022 Chart
2022
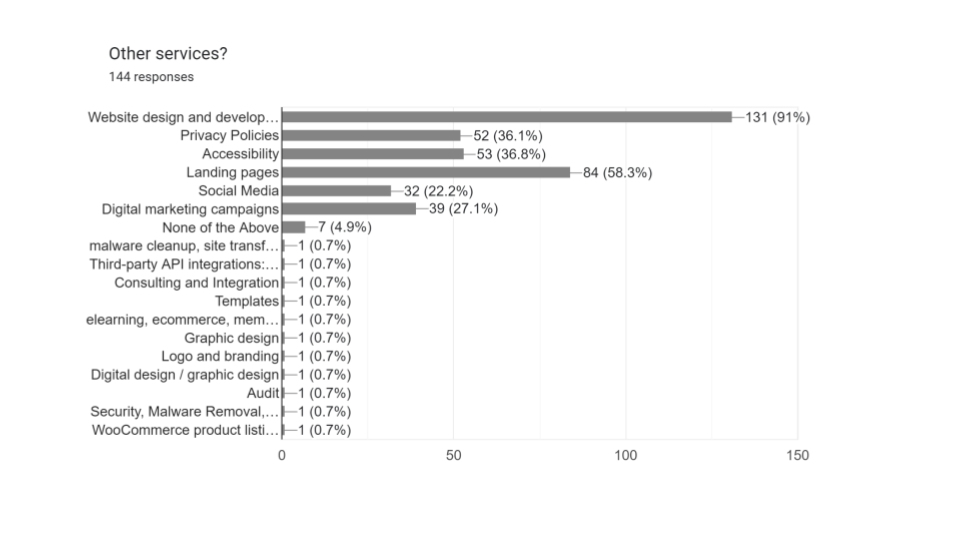
As for “Other Services,” Website Design and Development remained strong, going up to 91% from 90.8%. It seems our Web Care Consultants still do website development.
Digital Marketing dropped from 33.6% to 27.1% which I found interesting.
Privacy Policies are up to 36.1% from 33.6% and Accessibility jumped up significantly this year.
These two types of services are becoming much more necessary for those managing websites. Social Media help also dropped from 26.7% to 22.2%.
2021 Results
2022 Chart

2022
The software and plugin licenses are always an interesting conversation. Most people still provide them, although many make it dependent on being on a care plan.
It also depends on the type of website and the situation. Depends as an answer actually increased this year from 22.9% to 28.5%.
As with many things in our industry, this is very situational.
Most Web Care Consultants will provide licenses for tools they use across their agency such as backups, caching services, any kind of developer license, themes, standard set of agency licenses, etc. Licenses needed for a 1:1 site, consultants require customers to pay for them.
The key here is if the consultant has a lifetime or agency license for a standard set of software. Most consultants do not maintain this if a customer leaves their Web Care plan.
Several Web Care Consultants said they included licenses on higher tier plans but not the lower and base plans.
2021 Results
2022 Chart

2022
2021
2022 Chart

2022
Most consultants offer some sort of hosting. After all, with the many professional hosting companies, it can be an easy value add.
In fact, in the 2022 survey, more people offer hosting than did in the 2021 survey.
The top three types of hosts continue to be VPS, Shared, and Dedicated. Shared and Dedicated was a little higher than in last year’s survey. VPS dropped a small amount.
2021 Results
2022 Chart
2022
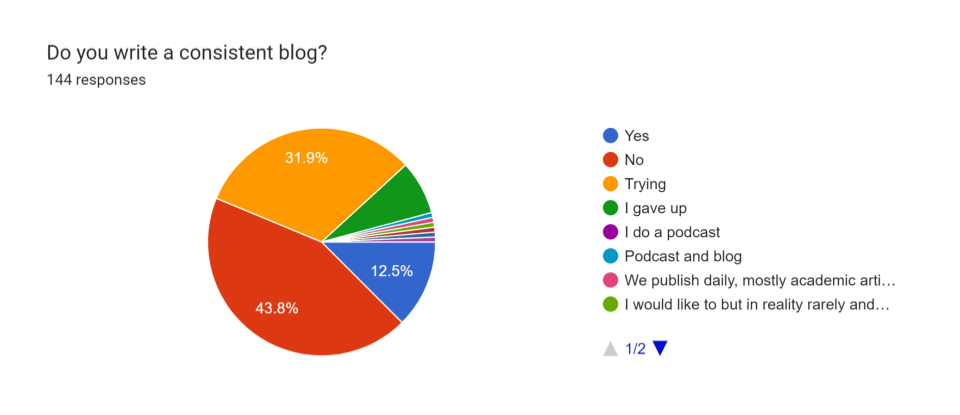
A few more of you are actually writing blog posts. Well done! More people said no and fewer people said Trying.
2021 Results
2022 Chart
2022
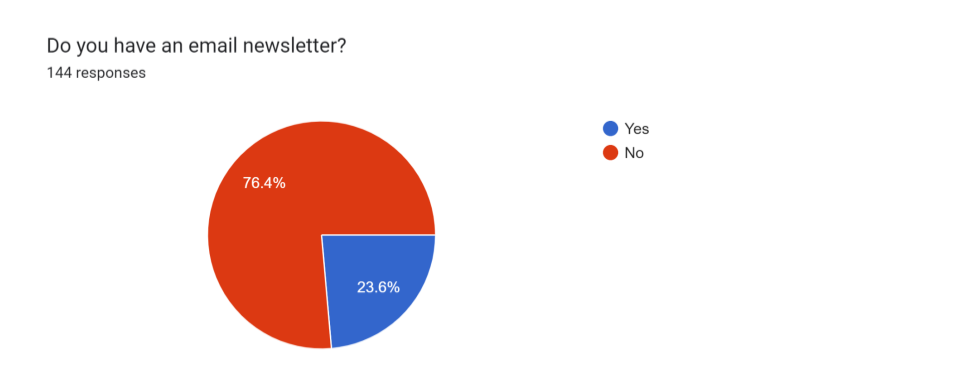
Fewer people have a newsletter than the year before. The email newsletter thing still seems to elude our Web Care Consultants. To be far, it is one way to generate leads and there are plenty other ways. I find this more fascinating considering more people are providing this service for their clients while doing less of it for themselves.
Why do you think this is?
2021 Results
2022
We have a few more respondents this year than last year, so that may have something to do with why each of the top 4 target markets increases slightly. Nevertheless, the four top markets remain the same: Small Medium Businesses (SMB), B2B Businesses, Other Freelancers & Consultants, and Large Enterprise Businesses.
Here are five takeaways I have from the 2022 Web Care Consultant Survey.
Web Care is still a strong service in our industry. For many of us, it is an efficient way to earn recurring revenue for our agencies.
One thing I noticed looking through the data, several consultants offer various types of custom packages that are based on the particular situation of the website. We may list our web care pricing plans, but we realize those pricing plans have limits for higher value and more custom solutions.
For your ease, here is the infographic comparing 2022 with 2021.
Feel free to use, download, or share the below infographics wherever you want.

Manage Unlimited WordPress Sites from One Dashboard!
3 comments
Chris
Interesting. Not sure if the results or the questions asked are more interesting. The graphs are in the way. Lead with the infographic.
Arpad Szucs (WhiteX)
Very interesting read. It’s nice to see how other professionals do their business. Personally I tend to offer custom solutions to most of our customers, because every business is different. There are some basic / starting packages, but most of the time they need something else / more / different.
Laxmikant Bhumkar
Interesting survey. Stunned by knowing that most agencies neither use newsletters nor maintain a blog.
Comments are closed.